
The t-test, Explained Without the Textbook Voice
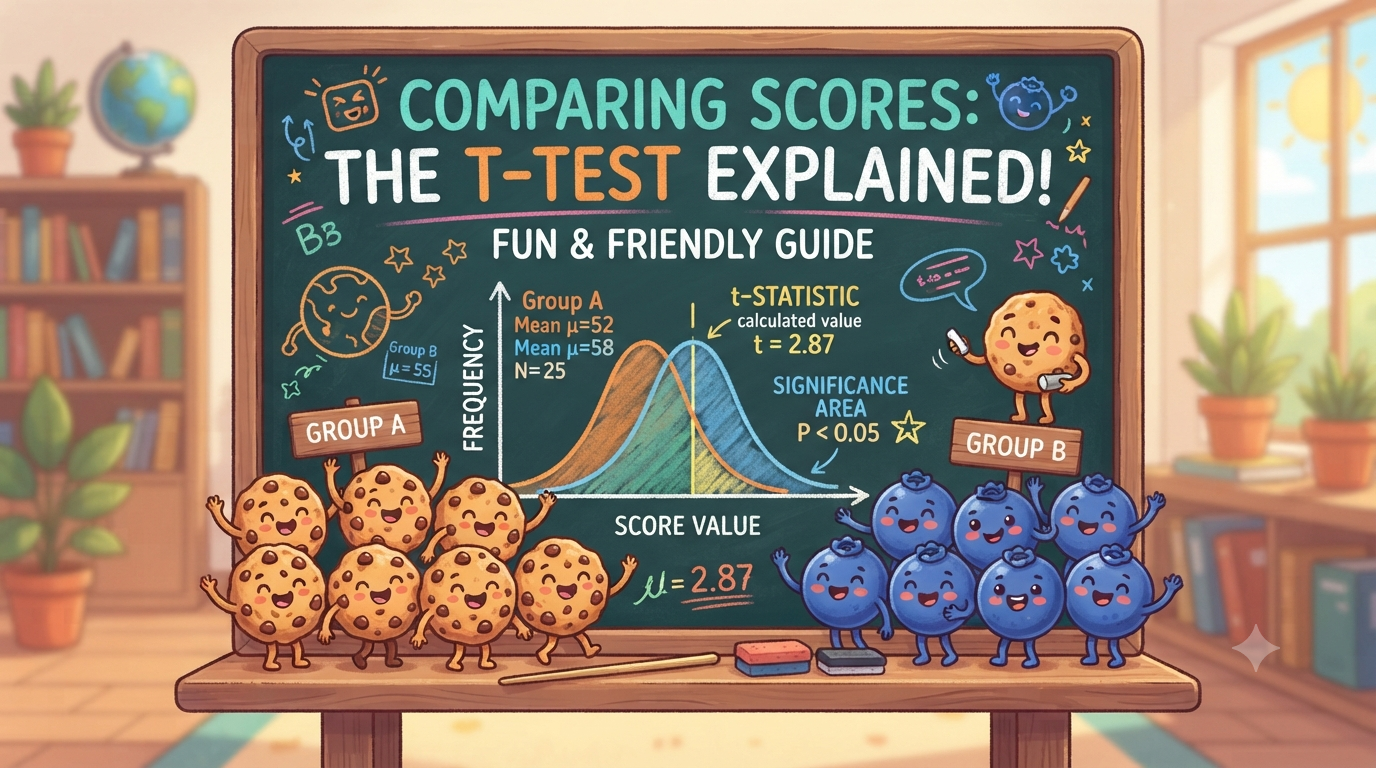
The first time I ran a t-test, I had no idea what I was looking at. The code ran, a p-value appeared, and I nodded like I understood. I didn't.
So here's the explanation I wish I'd had. No formulas until the end, and only a few then.
The question a t-test answers
You have two groups of numbers and their averages differ. Is that difference real, or did you just get a lucky sample?
That's the whole thing. Everything else is detail.
A cookie experiment
Say you bake cookies two ways, one with white sugar and one with brown sugar, and five friends rate each batch out of 10.
| Recipe | Ratings | Average |
|---|---|---|
| White sugar | 6, 7, 6, 7, 6 | 6.4 |
| Brown sugar | 8, 7, 8, 9, 8 | 8.0 |
Brown sugar wins by 1.6 points. But five people is a tiny crowd. Maybe they were hungry, or in a good mood, or one of them just likes you. You can't tell from the averages alone.
A t-test gives you a way to check.
What it actually weighs
Two things, really.
The size of the gap. A bigger difference between averages is harder to blame on luck.
How noisy the data is. If everyone in a group gives nearly the same score, a gap between groups means something. If scores are scattered from 1 to 10, the same gap could easily be noise.
A 2-point difference between two groups that all scored 6 or 7 is convincing. A 2-point difference between groups that range from 1 to 10 is not. The t-test turns this intuition into a number.
The p-value, in plain words
The test spits out a p-value. Here's what it means, and I'll be careful because it's often misexplained:
If there were truly no difference between the groups, how often would random chance alone produce a gap this big, or bigger?
For the cookies, the p-value comes out around 0.004. So if the recipes were secretly identical, you'd see a gap this large only about 0.4% of the time. That's rare enough that most people would say the difference is probably real.
The usual cutoff is 0.05. Below it, we call the result "statistically significant." Above it, we say we don't have enough evidence. That 0.05 is a convention, not a law of nature.
What the p-value does not tell you is the probability that brown sugar is better. People say this all the time, and it's wrong.
Three flavours of t-test
One-sample: compare one group against a known number. Is this class's average different from the national average of 70?
Independent (two-sample): compare two separate groups, like the cookie example, or users on app version A versus version B.
Paired: compare the same people twice, like before and after.
Here's a paired example. Five students take a test, get tutoring, and take another one.
| Student | Before | After | Change |
|---|---|---|---|
| 1 | 50 | 58 | +8 |
| 2 | 60 | 65 | +5 |
| 3 | 55 | 60 | +5 |
| 4 | 70 | 72 | +2 |
| 5 | 65 | 71 | +6 |
Everyone improved, but by different amounts. A paired t-test looks at those five changes and asks whether an average gain of 5.2 points is consistent enough to trust. It is (p ≈ 0.006).
Paired tests are more powerful than people expect, because each person acts as their own control. You're not comparing different people, so a lot of the noise disappears.
Running it in Python
from scipy import stats

white = [6, 7, 6, 7, 6]
brown = [8, 7, 8, 9, 8]

# Independent t-test
t, p = stats.ttest_ind(white, brown)
print(f"t = {t:.2f}, p = {p:.4f}")
# t = -4.00, p = 0.0039

# Paired t-test
before = [50, 60, 55, 70, 65]
after  = [58, 65, 60, 72, 71]

t, p = stats.ttest_rel(before, after)
print(f"t = {t:.2f}, p = {p:.4f}")
# t = -5.36, p = 0.0058
One tip: for independent groups, pass equal_var=False to ttest_ind. That runs Welch's t-test, which doesn't assume both groups have the same spread. It's a safer default, and many statisticians recommend it.
The one formula
If you want to see what's under the hood, the t statistic is roughly:
t = (difference between averages) / (noise in that difference)
A large t means the gap is big compared to the noise. In the cookie example, the gap is 1.6 and the noise works out to 0.4, so t = 4. Then the p-value is looked up from that t and your sample size.
When not to trust it
A t-test isn't a magic stamp of truth. A few things to watch:
- Tiny samples with wild outliers can mislead it. One strange value can swing everything.
- Very skewed data might call for a different test, like Mann-Whitney.
- Many tests at once is a trap. Run 20 tests at the 0.05 level and one will look "significant" by pure luck.
- Significant is not the same as important. With a huge dataset, a trivially small difference can produce a tiny p-value. Always ask whether the difference is big enough to matter.
The short version
A t-test asks whether the difference between two averages is bigger than what luck would usually produce. Big gap and tidy data give you a small p-value. Small gap and messy data give you a large one.
That's most of what you need to use it sensibly.
About the author
- ata Analyst | SQL, Python, Power BI | Writing about projects and what I learn
Comments
Join the discussionNo comments yet. Be the first to comment.